Datawrapper is an accessible platform used to visualize data, which makes the process of transforming numerical data into visualizations easier. Use this block if you want to build a simple but interactive chart.
How to log into Datawrapper
- Make sure you have a 1Password MoFo account.
- Ensure you have the 1Password browser extension installed: https://1password.com/downloads/#browsers
- Visit https://app.datawrapper.de/signin/. If you're logged into your 1Password account using the browser extension, and you click login and click the email field, you'll see a drop down to choose an account. Click that and 1Password will autocomplete the login for you.

Once you have logged in, you can create new visualizations or search the achieve/dashboard for old ones. Click on the "Create New" Button on the top right to create a new chart/map!
Uploading Data
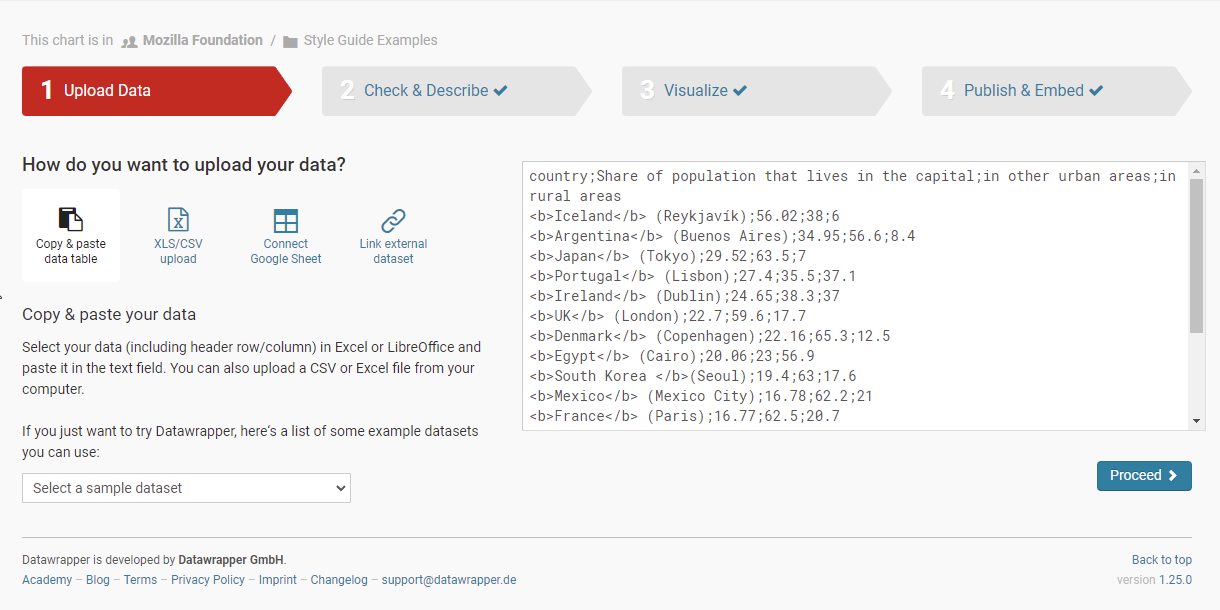
- The first step is getting your data in working form on a spreadsheet.
- Datawrapper accepts Excel, CSV (comma seperated values), and Google Sheets
- Datawrapper also allows you to add HTML tags if you copy and paste the data table values
- There is also an option for using sample datasets if you want examples of how to format your data
Visualization Types
Datawrapper supports these chart types out of the box:
- Bar Chart
- Split Bars
- Stacked Bars
- Grouped Bars
- Bullet Bars
- Dot Plot
- Range Plot
- Arrow Plot
- Column Chart
- Grouped Column Chart
- Stacked Column Chart
- Lines
- Area Chart
- Pie Chart
- Donut Chart
- Multiple Pie Charts
- Multiple Donut Charts
- Scatter Plot
- Election Donut Chart
- Table
- Choropleth Map
- Symbol Map
- Locator Map
Publishing and using the Streamfield block
In order to use your chart on a new page, you must publish your visualization/chart on Datawrapper first!
- On the Share & Embed Section on the Publish & Embed Page, make sure that the Link to your visualization is set to Visualization Only
- Publish your chart when you finish creating your chart
- Copy to clipboard the link found on Link to your visualization input.
- In wagtail, navigate to the page that you would like to add the chart.
- Create a new section by clicking on the green "+" at the bottom of the edit page.
- Select "Datawrapper" and paste the link in the block. (EG: https://datawrapper.dwcdn.net/0rmUn/3/)


Helpful Links and Resources
- https://www.datawrapper.de/training-materials
- https://blog.datawrapper.de/datawrapper-training-materials-for-workshops/
- Academy - place to go to learn more about the tool and the different visualization types
- Blog - learn about data viz best practices and new features
- Developer Docs - where you can learn more about our API